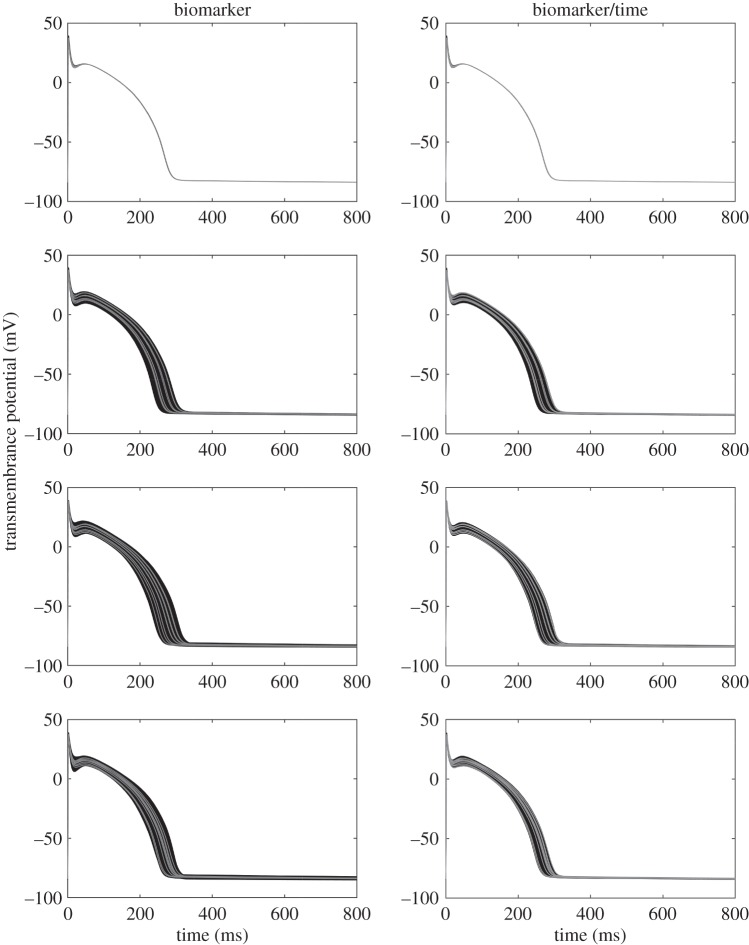
Figure 2.
Simulations from the BR model based on the SMC POM. The left-hand and right-hand columns are based on the biomarker statistics and biomarker/time statistics, respectively. From top to bottom shows results for parameter sets 1–4, respectively. The observed data are shown as grey trajectories, whereas the simulated trajectories from the POMs are shown in black.

