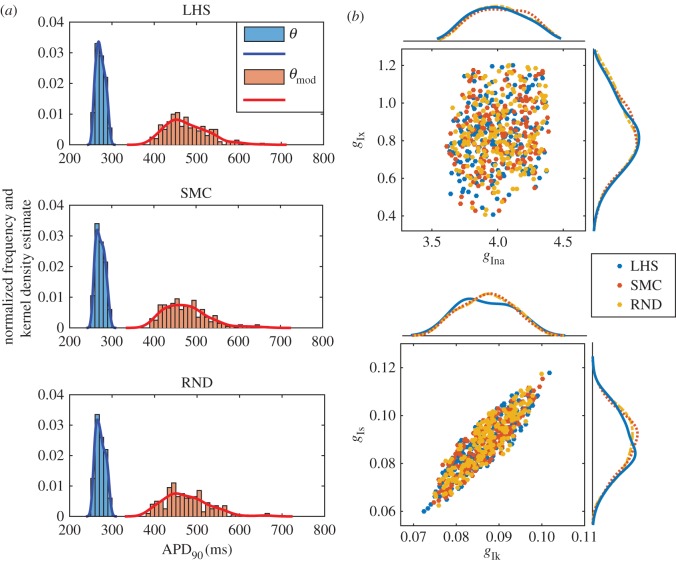
Figure 6.
APD90 distribution and scatter plot of parameter values for the three POMs considered in the study. (a) APD90 distribution for the three POMs considered, before (blue) and after (red) drug block. In each plot, we superimpose a kernel density estimate to the normalized histograms of the APD90 obtained from the solutions trajectories corresponding to the set of parameters θ and the set of modified parameters θmod. (b) Scatter plots and corresponding kernel density estimates for the location of the four components ( ) of the 200 parameters θmod obtained with the three POM strategies.

