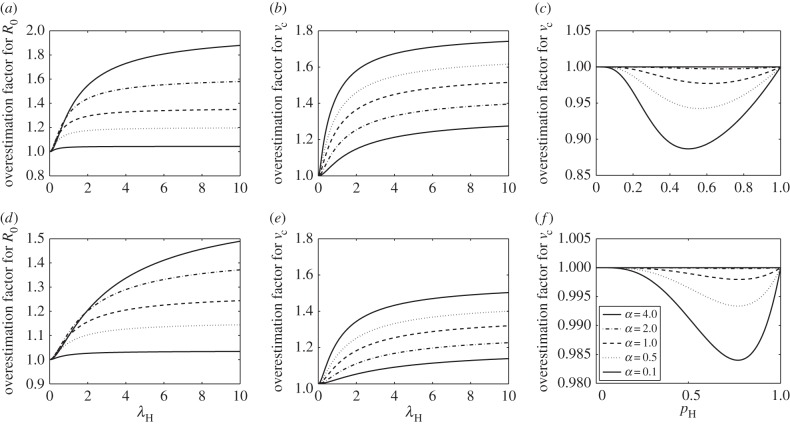
Figure 3.
The factor by which estimators based on homogeneous mixing overestimate key epidemiological variables in a population structured by households. The basic reproduction number R0 for Markov SIR epidemics with expected infectious period equal to 1 (a,d), critical vaccination coverage vc for Markov SIR epidemics (b,e) and vc for Reed–Frost epidemics (c,f), as a function of the relative influence of within-household transmission, in a population partitioned into households. For (a–c), the household size distribution is taken from a 2003 health survey in Nigeria [29] and is given by 


 for
for  mi is the fraction of the households with size i. For (d–f), the Swedish household size distribution in 2013 taken from [30] is used and is given by


 . The global infectivity is chosen, so that the epidemic growth rate α is kept constant while the within-household transmission varies. Homogeneous mixing corresponds to
  , in which case
  . Note that the order of the graphs is different in (b) and (e) from that in (a,c,d,f).

