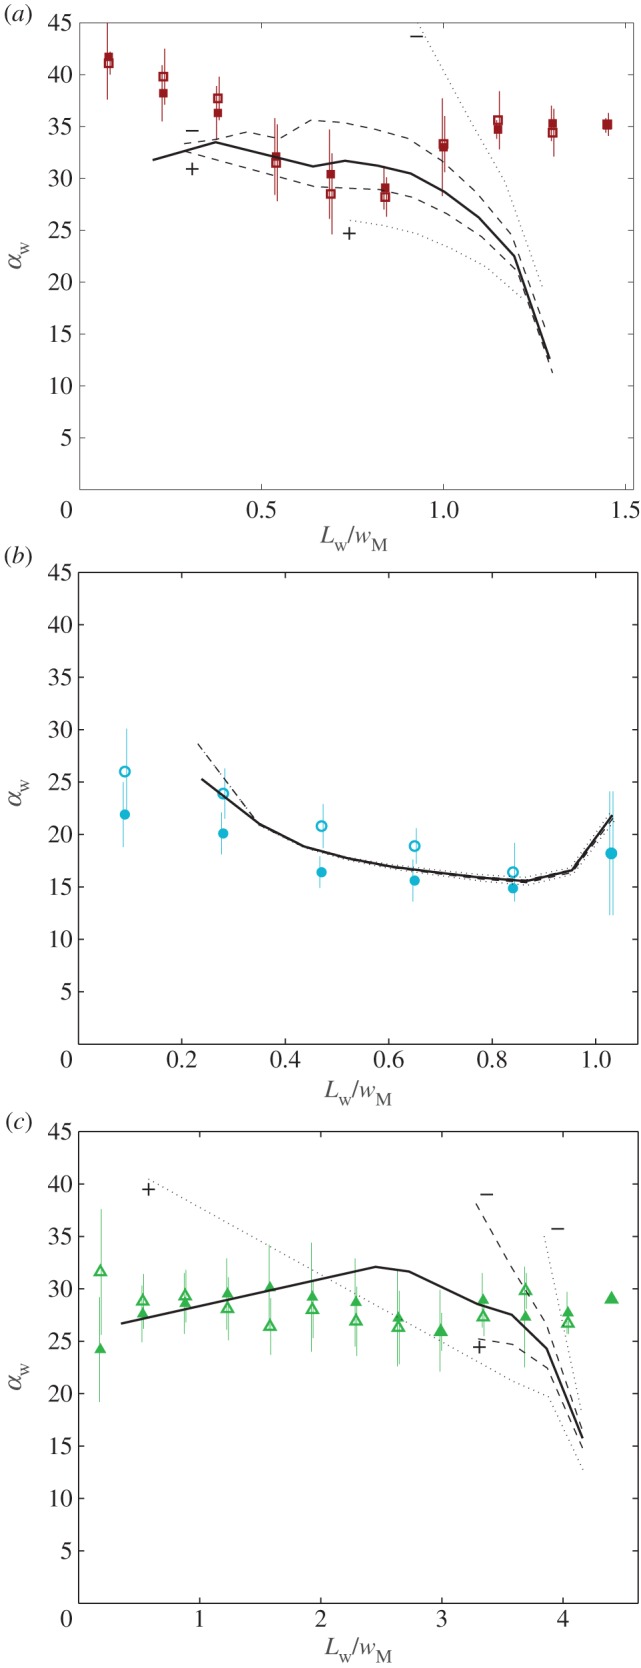
Figure 8.

Seta inclination  at the fluid–air interface plotted against contact length
  ; symbols show the average of many measurements over 10 seta tips from the same individual. (a) Spatula-shaped (squares), (b) discoidal (circles) and (c) pointed tips (triangles). Filled symbols represent loading (increasing z), and empty symbols unloading (decreasing z). Solid, dashed and dotted lines represent fits by the elasto-capillary model for a friction coefficient of
  , ±10 and ±30 kPa, respectively. Additional plus and minus symbols indicate the sign of coefficient
  . Thickness profile
  (equation (4.5)) was used for the fit of discoidal tips, and profile
  (equation (4.6)) for spatula-shaped and pointed tips. (Online version in colour.)
