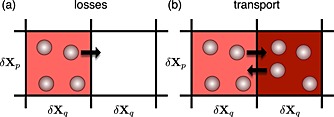
Figure 3.

Illustration of two limits of the processes contributing to variation in the phase space density in a grid cell of test particle simulations: (a) variation of the number of particles, N k without changing the average weight; and (b) variation of the average weight, 〈w〉k without changing the number of particles.
