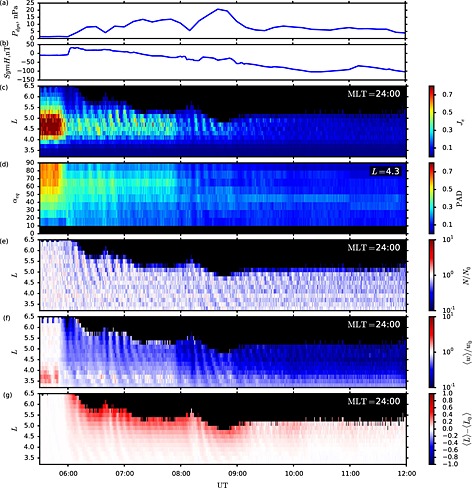
Figure 4.

Test particle simulation of electron intensities during first 6 h of 17 March 2013 storm. The figure shows (a) 10 min averaged solar wind dynamic pressure, P dyn; the (b) SYM‐H index; (c) the simulated intensity of 1.25–1.50 MeV electrons with near‐perpendicular pitch angles of 80–90° along the midnight meridian at the magnetic equator; (d) the pitch angle distribution of 1.25–1.5 MeV electron intensity at L = 4.3, (e) the normalized number of particles with initial energies of 1.25–1.50 MeV and initial pitch angles of 80–90°; (f) the normalized average weight of particles with current values of energy of 1.25–1.50 MeV and pitch angles of 80–90°; and (g) the average change in their location along the midnight meridian at the magnetic equator. More details can be seen in Movie S1 in the supporting information.
