
Figure 7.
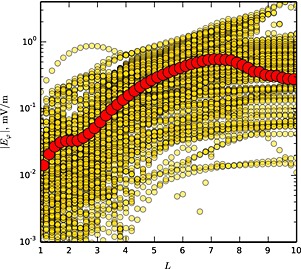
The amplitude of the azimuthal component of the inductive electric field along the y=z=0 axis of the TS07D model. Yellow symbols show instantaneous values, and red symbols show the average values computed over the entire simulation period.
Official websites use .gov
A
.gov website belongs to an official
government organization in the United States.
Secure .gov websites use HTTPS
A lock (
) or https:// means you've safely
connected to the .gov website. Share sensitive
information only on official, secure websites.
The amplitude of the azimuthal component of the inductive electric field along the y=z=0 axis of the TS07D model. Yellow symbols show instantaneous values, and red symbols show the average values computed over the entire simulation period.