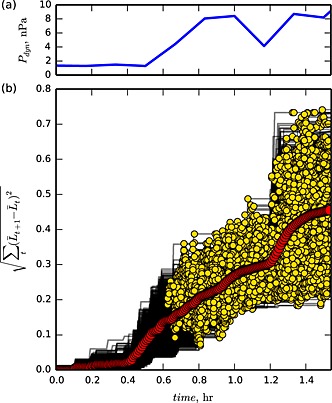
Figure 8.

Radial transport of ∼2·103 particles. Time is measured in hours from the simulation start. All particles are lost through the magnetopause in 1.5 h. (a) The solar wind dynamic pressure, P dyn. (b) along individual particle trajectories (black lines). The points of drift orbit bifurcations are marked with yellow symbols. Evolution of computed by averaging transport over all trajectories is shown in red.
