Figure 1.

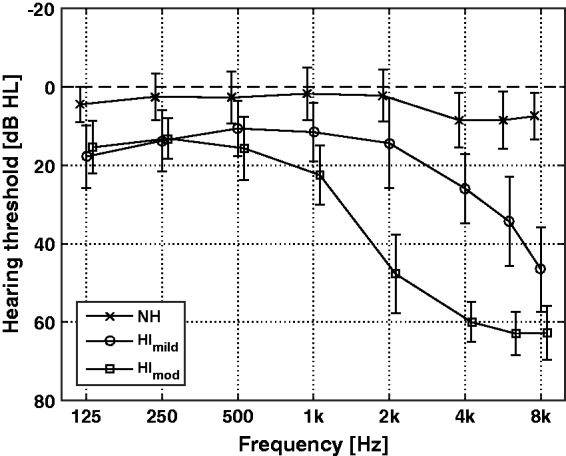
Audiometric data of the listener groups, averaged over both ears of the listeners. Horizontal bars denote ± 1 SD. The data of the NH and HImod listener groups are shifted on the x-axis for better readability.

Audiometric data of the listener groups, averaged over both ears of the listeners. Horizontal bars denote ± 1 SD. The data of the NH and HImod listener groups are shifted on the x-axis for better readability.