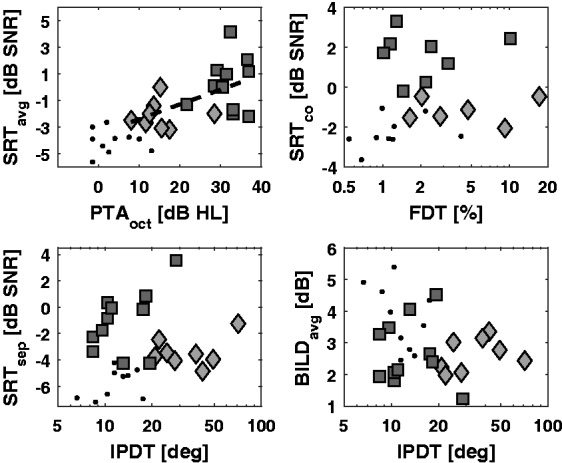
Figure 6.

Scatter plots between predictor measures and speech perception results for the NH (black dots), HImild (light gray diamonds), and HImod (dark gray squares) listeners. Top left: SRTavg as a function of PTAoct. The dashed line stands for the fitted regression line on the data of the HImild and HImod listeners. Top right: SRTco as a function of FDT. Bottom left: SRTsep as a function of IPDT. Bottom right: BILDavg as a function of IPDT.
