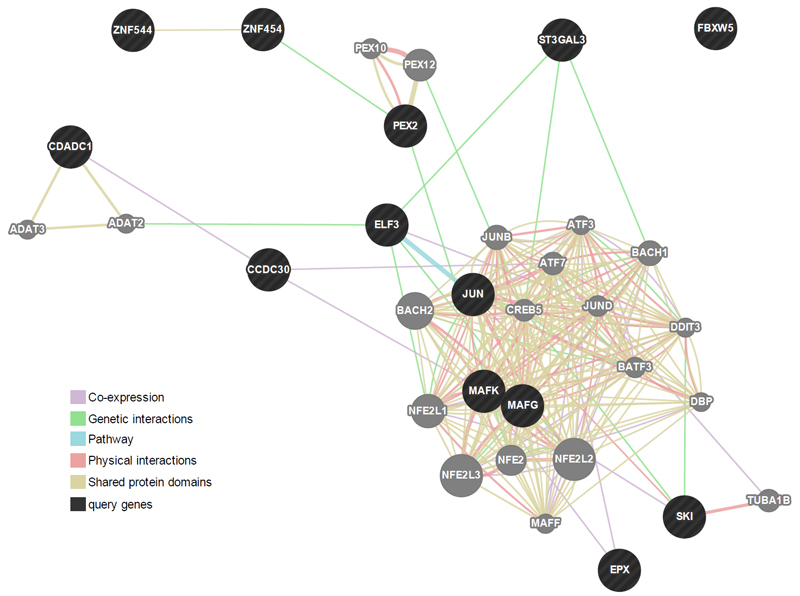
Figure 3.
Gene network analysis using GeneMANIA. Darker circles represent genes associated with the 13 probes found to be related to ADHD trajectories in the methylome-wide analysis at birth. Lighted circles represent additional genes predicted by GeneMANIA based on genetic and physical interactions, shared pathways and protein domains as well as protein co-expression data. The gene network analysis demonstrates that, rather than being isolated (e.g. FBXW5), these genes clustered into a complex interconnected network. For more information on GeneMANIA methods, see Supplementary section 2.2.

