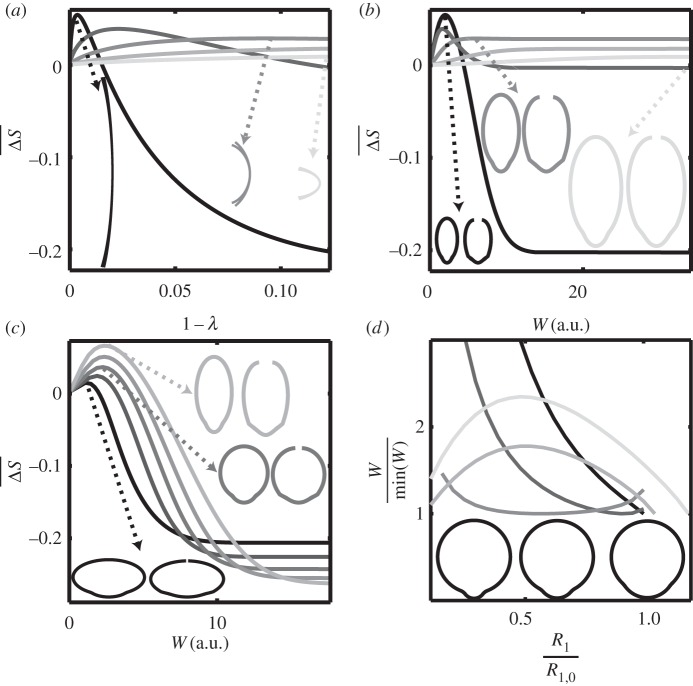
Figure 4.
(a,b) Influence of x−z shape, the rest state volume Vol being identical. R1∈{0.71,0.96,1.23,1.48,1.73}, α1=0.54, α2=0.37, b=0.5, c=10, (the darkness of the grey of the line in the plot increases with d). . (a) Normalized opening versus vertical deformation 1−λ. The arrows point to the corresponding rest state contour (x(0,.,0),z(0,.,0)) and deformed contour (x(0,.,h),z(0,.,h)) at maximal opening. (b) Normalized opening versus energetical cost W. The arrows point to the corresponding rest state contour (x(0,.,0),y(0,.,0)) and deformed contour (x(0,.,h),y(0,.,h)) at maximal opening (the scale is 0.3 smaller than that for the x−z curve on (a)). (c,d) Influence of x−y shape: (c) at constant Vol, normalized opening versus energetic cost W. R1∈{0.71,0.96,1.23,1.48,1.73}, α1=0.54, α2=0.37, (the darkness of the grey of the line in the plot increases with b), . The arrows point to the corresponding rest state contour (x(0,.,0),y(0,.,0)) and deformed contour (x(0,.,h),y(0,.,h)). (d) Energetic cost normalized by its minimum versus R1 for constant and constant rest state volume Vol. R1,0∈{0.71,0.96,1.23,1.48,1.73}, 0.1<R1/R1,0<1.1, α1,0=0.54, α2,0=0.37, b=1, c=10, , v0=0.94, . The three contours represented at the bottom are the rest state contours (x(0,.,0),y(0,.,0)), while R1 is varying.

