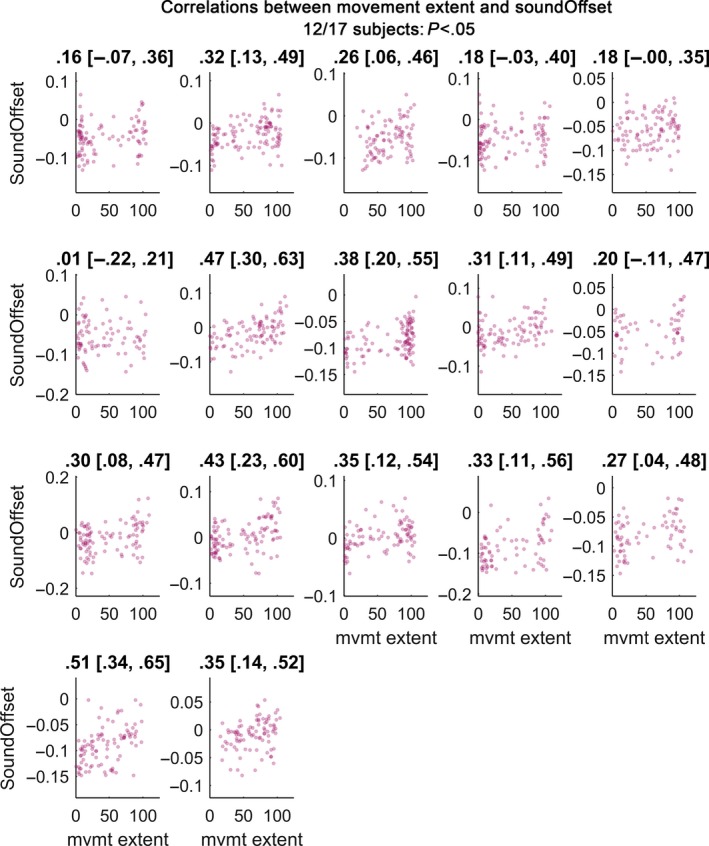
Figure 3.

Scatter plot of correlations between movement extent (x‐axis) and tap‐to‐sound offset (y‐axis). Subplots show individual participants. Plot titles denote Spearman's rho followed by its 95% bootstrapped confidence interval. Participants were less likely to stop when the last regular tap was relatively late with respect to the metronome sound. 12 of 17 subjects had significant correlations.
