
Figure 4.
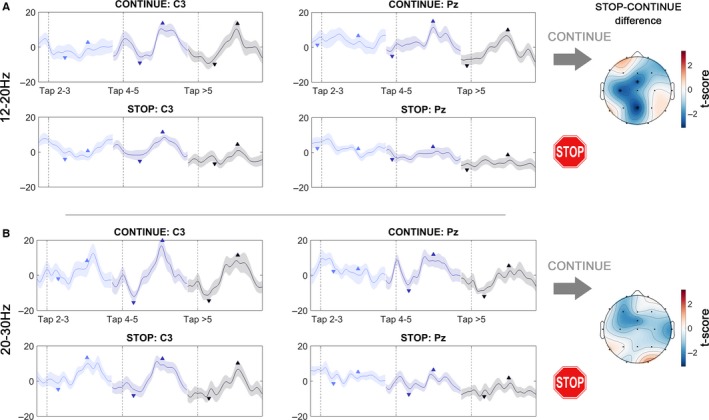
Temporal development of the % change in (A) 12–20 Hz and (B) 20–30 Hz power. The left and right column depict modulation in the electrodes C3 and Pz respectively. Data are aligned to taps as denoted in the legend showing one tap‐cycle within a – 100 : 600 ms window. The left, middle and right traces depict early (2–3), middle (3–4) and late (> 5) taps respectively. Downward arrows denote the location of the average power trough, and upward arrows denote the location of the average power peak, which was used to compute the modulation. In (A) the 12–20 Hz modulation developed in the CONTINUE condition (upper row) after the third tap both in C3 and Pz. In the STOP condition, modulation was strongly attenuated, particularly in Pz. In (B) the average 20–30 Hz modulation was again stronger in C3 than in Pz, and modulation increased after the third tap. Topoplots to the right show the distribution of negative t‐scores of the condition differences in modulation, which were significant in Pz, C3 and FCz for the low‐beta band.