
Figure 5.
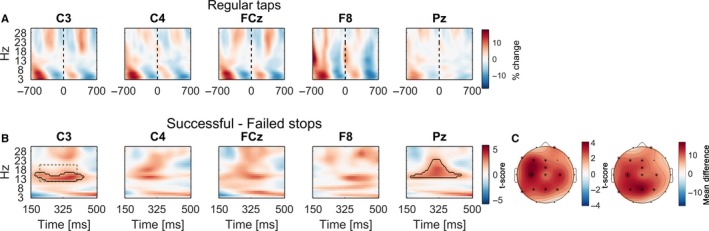
EEG preceding the stop signal. (A) Power aligned to regular taps (time = 0) in the STOP condition. The black dashed line denotes the finger contact with the pressure sensor. Power was z‐transformed for each frequency within the time window displayed before being averaged across subjects for better visual display. (B) t‐Scores of power differences between successful and failed stops prior to the stop signal. Clusters surrounded by black outlines denote that power was significantly higher when participants interrupted their movement more successfully (movement extent threshold < 40%). (C) Topoplots show the distribution of t‐scores and mean differences. In locations marked with a star, 12–20 Hz beta was significantly higher prior to successful stops averaged within the window outlined by the dashed rectangle in (B) in C3. The channel location of C3 in the topoplots is highlighted with a black circle surrounding the star.