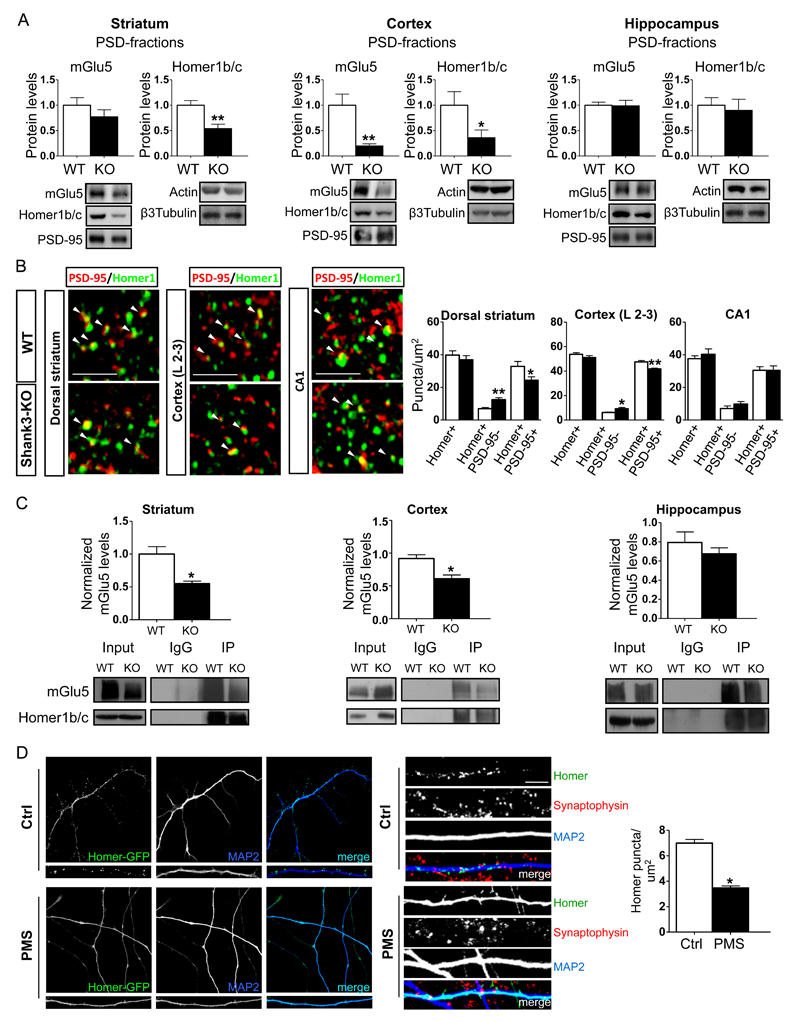
Figure 2.
Shank3 absence alters Homer and mGlu5 receptor synaptic localization. A) Protein levels of metabotropic glutamate receptor 5 (mGlu5) and Homer1b/c were analyzed using Western Blot analysis in postsynaptic density (PSD) fractions obtained from tissues in the striatum cortex and hippocampus of wild-type (WT) and Shank3Δ11-/- mice. Protein levels were each normalized against the respective PSD-95 and ratios were compared between genotypes. The results are shown as bar diagrams, and representative blots are shown below. All data are presented as the mean ± SEM; all P-values were derived using unpaired, two-tailed Student’s t-tests; *, p<0.05; **, p<0.01. Analyses are based on a sample size of n=6 animals for each group (WT and KO). B) Representative confocal micrographs showing PSD-95 (red) and Homer1 (green). Co-labeled puncta (arrowheads) are visible in high magnification images. The images show immunofluorescence puncta in the neuropil of the dorsal striatum, layer 2-3 of the primary somatosensory cortex and in the CA1 of the hippocampus in Shank3Δ11-/- and KO mice. The results are shown as bar diagrams. Data are presented as mean ± SEM. * p<0.05; ** p<0.01. Analyses are based on a sample size of n=6 animals for each group (WT and KO). Scale bars: 3 μm. C) PSD-enriched preparations of the striatum cortex and hippocampus were obtained from three P60 WT and KO mice and subjected to an in vitro immunoprecipitation assay using rabbit Homer1b/c antibodies. The immunoprecipitated proteins were revealed after immunoblotting using rabbit mGlu5 and Homer1 antibodies. A rabbit IgG antibody was used as the negative control. The data are expressed as the mean ± SEM of three independent experiments and we used n=2 animals for each group (WT and KO) and experiment. *, p<0.05. D) The panels show representative images of hNP-derived neurons and dendrites from control and PMS patients, which, after infection with a lentivirus expressing Homer-GFP, were differentiated in neuronal differentiation medium for 80 days. The staining (right panel) shows that GFP-Homer1b clusters in iPSC-derived neurons colocalize with the presynaptic marker Synaptophysin. Scale bar 10μm The results are shown as bar diagrams. The data are presented as the mean ± SEM of three independent experiments and we used n=2 independent hNP for each individuals. *, p<0.05.

