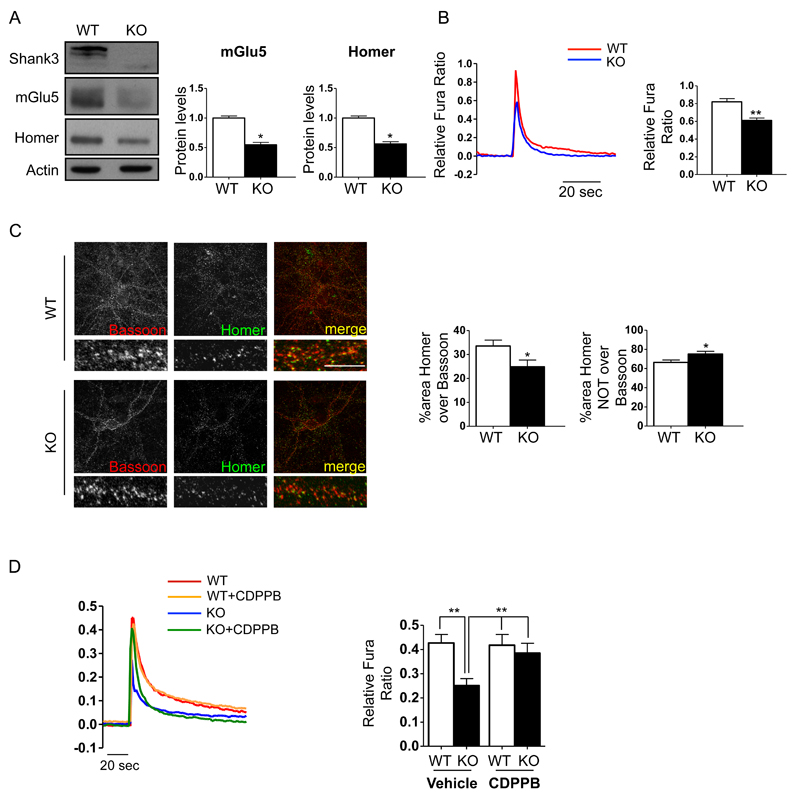
Figure 3.
Shank3 absence impairs mGlu5-mediated intracellular calcium release in cortical neurons. Cortical neuronal cultures were prepared from WT and Shank3Δ11-/- E17-E18 mouse embryos. A) Western blot analysis of PSD-enriched fractions of cortical primary neurons obtained from WT and Shank3Δ11-/- mice at DIV15. Protein levels were each normalized against the respective actin control. Data are expressed as the mean ± SEM of n=3 independent cultures by genotype. *, p < 0.05. B) At DIV14-15 neurons were loaded with Fura-2 AM (5 µM, 30 min). After 20 min of de-esterification, the neurons were challenged with 200 µM DHPG. The results are shown as bar diagrams. Representative traces of Ca2+ transients are shown at the left, and the data are expressed as the mean ± SEM of n=127 WT neurons and n=151 KO neurons that were registered from 18 coverslips (for each genotype) in three independent cultures. *, p<0.05; **, p<0.01. C) Representative images of WT and Shank3Δ11-/- mouse primary cortical neurons at DIV15. Confocal images were obtained using a Confocal Microscope with a 63x objective and with sequential-acquisition set at a resolution of 1024 x 1024 pixels. A total of 16 WT and Shank3Δ11-/- primary cortical neurons at DIV15 were randomly chosen for quantification from 4 to 10 coverslips from three independent experiments. Colocalization measurements were performed using MetaMorph image analysis software. Scale bar 5μm . The histogram shows the mean ± SEM for the area of Homer clusters over the area of Bassoon clusters and the area of Homer clusters NOT over Bassoon clusters. *, p < 0.05. D) At DIV12-14 cortical neurons were loaded with Fura-2 and challenged with 200 μM DHPG either in presence (5 min preincubation) or in absence of of 3 μM CDPPB. Results are shown as bar diagrams. Representative traces of Ca2+ transients are shown left; data are expressed as mean ± SEM of n=86 WT neurons and n=77 KO neurons with vehicle and of n=96 WT neurons and n=95 KO neurons with CDPPB registered from 18 coverslips (for each conditions) in three independent cultures for genotype. * p < 0.05; ** p < 0.01.

