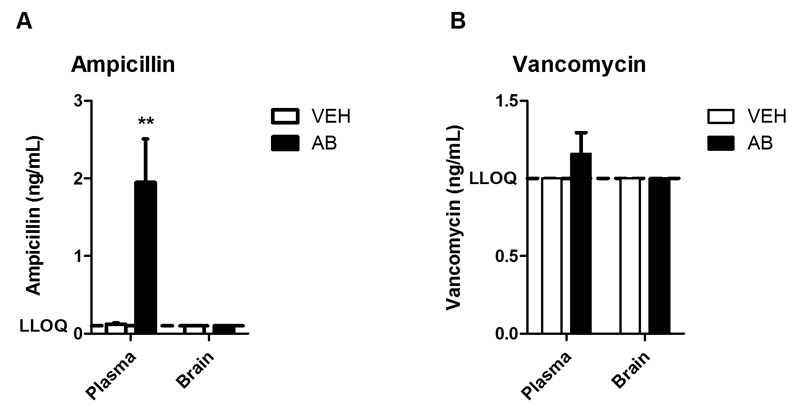
Fig. 2. Brain concentrations of ampicillin and vancomycin are below the respective lower limit of quantification.
The graphs depict concentrations of ampicillin (A) and vancomycin (B) in plasma and brain after 10 days of antibiotic (AB) treatment. The bars represent means + SEM, n=6-8; **p ≤ 0.01 compared to vehicle (VEH)-treated mice, Mann-Whitney U test.

