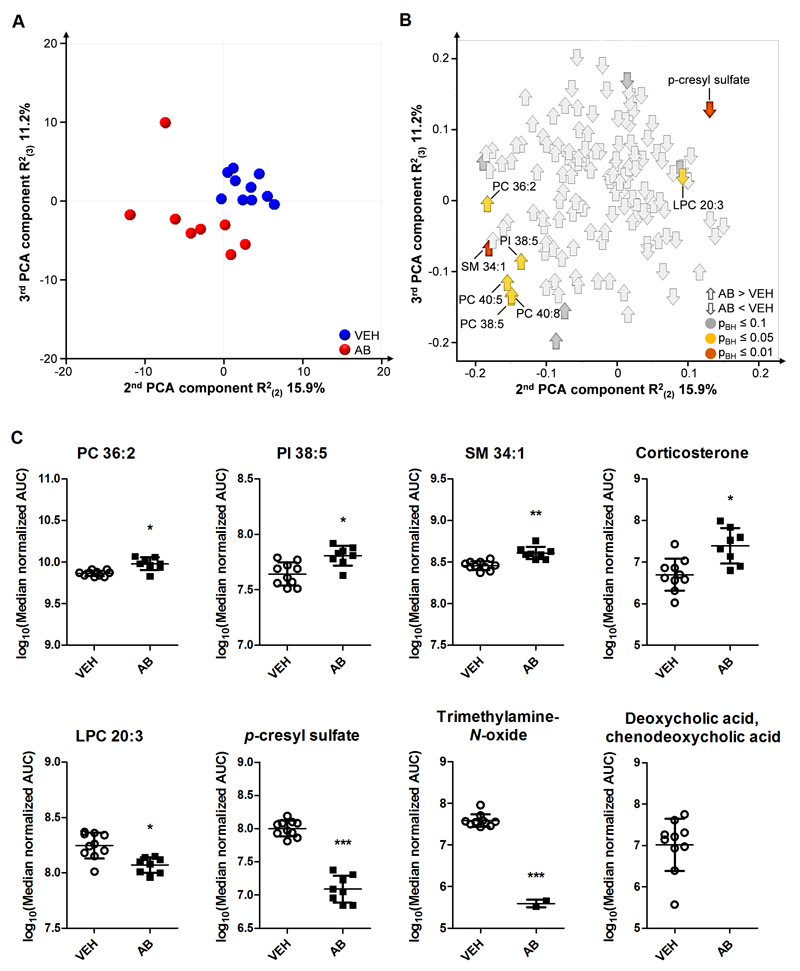
Fig. 5. Circulating metabolite levels are markedly altered by antibiotic treatment.
Mice were treated with antibiotic (AB) mix or vehicle (VEH) by gavage for 11 days. (A) Scores plot of the principal component analysis (PCA) with 148 identified circulating metabolites analyzed by LC-MS, showing group separation in the second and third components. (B) Corresponding loadings plot, showing the contribution of metabolites to group separation. Metabolites are colored according to Benjamini-Hochberg adjusted p-values. (C) Graphs of selected metabolites that were significantly different. Vertical bars represent the group mean, whiskers SD, n=8-10; *p ≤ 0.05, **p ≤ 0.01, ***p ≤ 0.001 compared to VEH-treated mice, Benjamini-Hochberg adjusted p-values. AUC, area under the curve; PC, phosphatidylcholine; PI, phosphatidylinositol; LPC, lysophosphatidylcholine; SM, sphingomyelin.

