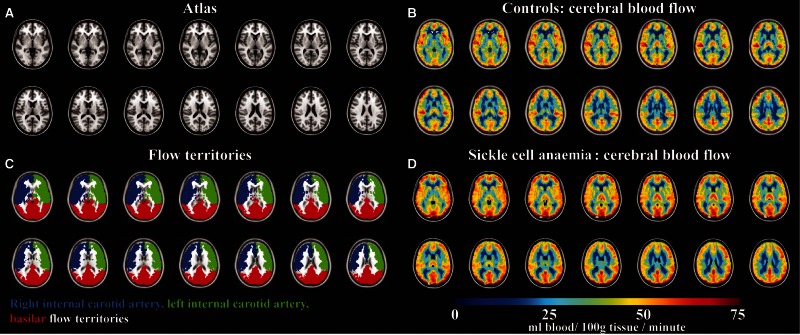
Figure 3.
Non-invasive CBF using pseudocontinuous arterial spin labelling imaging in patients with SCA and controls. (A) Central slices of a T1-weighted atlas, along with (B) regions analysed for CBF quantification. The flow territories were calculated from vessel-encoded arterial spin labelling data obtained from 92 subjects. CBF maps in (C) controls (n = 11) and (D) participants with SCA (n = 27) demonstrate increased CBF in participants with SCA.

