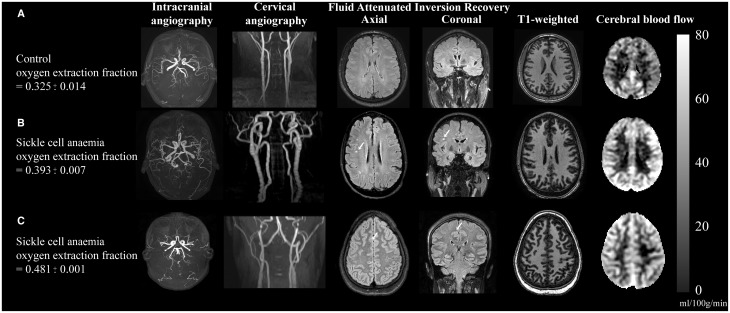
Figure 6.
Individual case examples of structural and haemo-metabolic imaging. (A) Control: A healthy 25-year-old male control with no vasculopathy or prior infarcts. Mean CBF in the grey matter mask (Fig. 3) is 40.6 ml/100 g/min and whole-brain OEF is 0.325, consistent with normal values. (B) Adult with SCA and silent strokes: A 29-year-old male with SCA on regular blood transfusion therapy for recurrent pain crises. His baseline haemoglobin is 7.7 g/dl, and his pulse oximetry shows an oxygen saturation of 95%. Magnetic resonance angiography of the brain does not reveal any vasculopathy, but prior silent strokes without overt neurological symptoms are apparent on FLAIR imaging (white arrows). The CBF is elevated relative to the control at 60.5 ml/100 g/min, as is the OEF = 0.393. (C) Adult with SCA and progressive infarcts: 25-year-old female with SCA with no history of overt stroke but silent cerebral infarcts apparent on MRI and elevated OEF on her study MRI with recurrent infarcts after this MRI. Her baseline haemoglobin was 7.7 g/dl, and pulse oximetry oxygen saturation of 92.5%. MRI shows a silent cerebral infarct (white arrow, axial and coronal views). Normal magnetic resonance angiography head and neck but CBF and OEF were elevated relative to controls at 51.3 ml/100 g/min and 0.48, respectively. Approximately 1 week after this study MRI, she presented with a typical pain crisis and developed a persistent headache. Clinical MRI showed two punctate foci of restricted diffusion consistent with new, tiny infarcts. Colour bar on right denotes CBF in units of ml/100 g/min.

