
Figure 1.
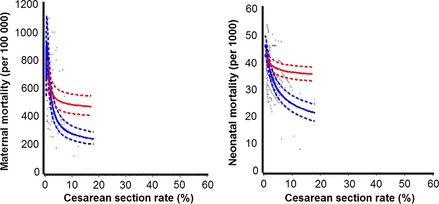
Relationship between caesarean section rates and maternal mortality and neonatal mortality, with and without adjusting for human development index (HDI), for least developed countries. Scatter plots and fractional polynomial regression model (estimates and 95% confidence intervals): blue curves, unadjusted models; red curves, adjusted models; solid curves, estimates; dashed curves, 95% CIs. (HDI standardised, mean HDI used to fit the curves of the adjusted model).