
Figure 2.
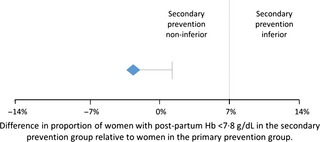
Non‐inferiority of secondary prevention relative to primary prevention. The diamond represents the point estimate of the difference in the primary outcome and the horizontal bar represents the one‐sided 95% CI for testing non‐inferiority. Non‐inferiority would be accepted if the 95% CI falls below the pre‐defined non‐inferiority margin of 7%.