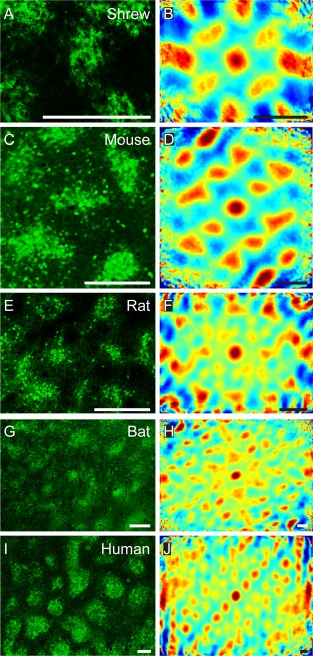
Figure 4.

Grid‐like arrangement of calbindin‐positive pyramidal cells in the medial entorhinal cortex. High‐magnification view of a tangential section of Etruscan shrew (A), mouse (C), rat (E), bat (G), and human entorhinal cortex (I). B,D,F,H,J: Two‐dimensional spatial autocorrelation of the respective panels to the left revealing a periodic spatial organization of calbindin‐positive patches. Color scale: –0.5 (blue) through 0 (green) to 0.5 (red), The mouse, rat, and bat samples exhibit hexagonal spatial organization, and their grid scores are 0.63 (C,D), 0.98 (E,F), and 0.82 (G,H), respectively. The Etruscan shrew and human exhibit rectangular spatial organization, and their cartesian scores are 1.39 (A,B) and 0.46 (I,J), respectively. C, caudal; D, dorsal; L, lateral; M, medial; R, rostral; V, ventral. Scale bar = 250 µm in A–J.
