Fig. 10.
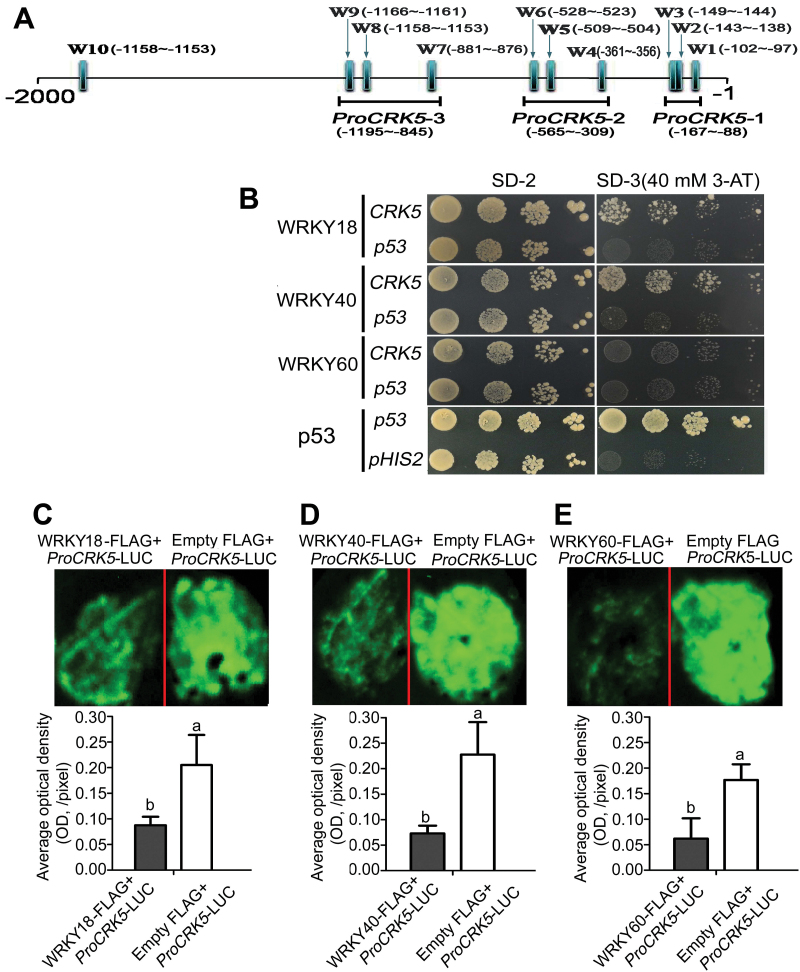
Test of the interaction of WRKY18, WRKY40 and WRKY60 with the promoter of the CRK5 gene. (A) Promoter diagram of the CRK5 gene. W1–W10 represent the W-box numbered from left to right with their location sites relative to the start codon (ATG). The segments marked with ProCRK5-1, ProCRK5-2 and ProCRK5-3 indicate the probe fragments used in the gel shift assays described in Fig. 11. (B) Yeast one-hybrid assays to test the interaction of WRKYs with the CRK5 promoter. Yeast cells were co-transformed with pGADT7 prey vector containing WRKY18, WRKY40, or WRKY60 and pHIS2 bait vector containing the promoter of CRK5. The corresponding transformation with pGADT7 prey vector containing WRKY18, WRKY40, or WRKY60 and pHIS2 bait vector containing p53 promoter fragment were used as negative controls. Co-transformation of pHIS2-p53 and pGADT7-p53 was used as positive control, and co-transformation of pGADT7-p53 and empty pHIS2 was used as its own negative control. Three 10-fold series dilutions were dropped vertically for each assay on SD-2 medium (synthetic dropout medium lacking Leu, Trp) and SD-3 medium (synthetic dropout medium lacking Trp, Leu, His) supplemented with 40mM 3-aminotriazole (3-AT). All the experiments were repeated five times with the same results. (C) WRKY18, (D) WRKY40 and (E) WRKY60 inhibit the transcription activity of the CRK5 promoter in tobacco system, assayed with luciferase (LUC) imaging. Tobacco leaves were co-transformed with the constructs ProCRK5-LUC plus WRKY18-FLAG or ProCRK5-LUC plus empty FLAG (C), or with the constructs ProCRK5-LUC plus WRKY40-FLAG or ProCRK5-LUC plus empty FLAG (D), or with the constructs ProCRK5-LUC plus WRKY60-FLAG or ProCRK5-LUC plus empty FLAG (E). Top panels in (C), (D) and (E): LUC fluorescence imaging. Bottom panels in (C), (D) and (E): optical densities calculated with the ImageJ software. The experiments were repeated three times with similar results. Each value for the columns in (C), (D) and (E) are the mean±SE of three biological determinations, and different letters represent significant differences at P<0.05 (Duncan’s multiple range test).

