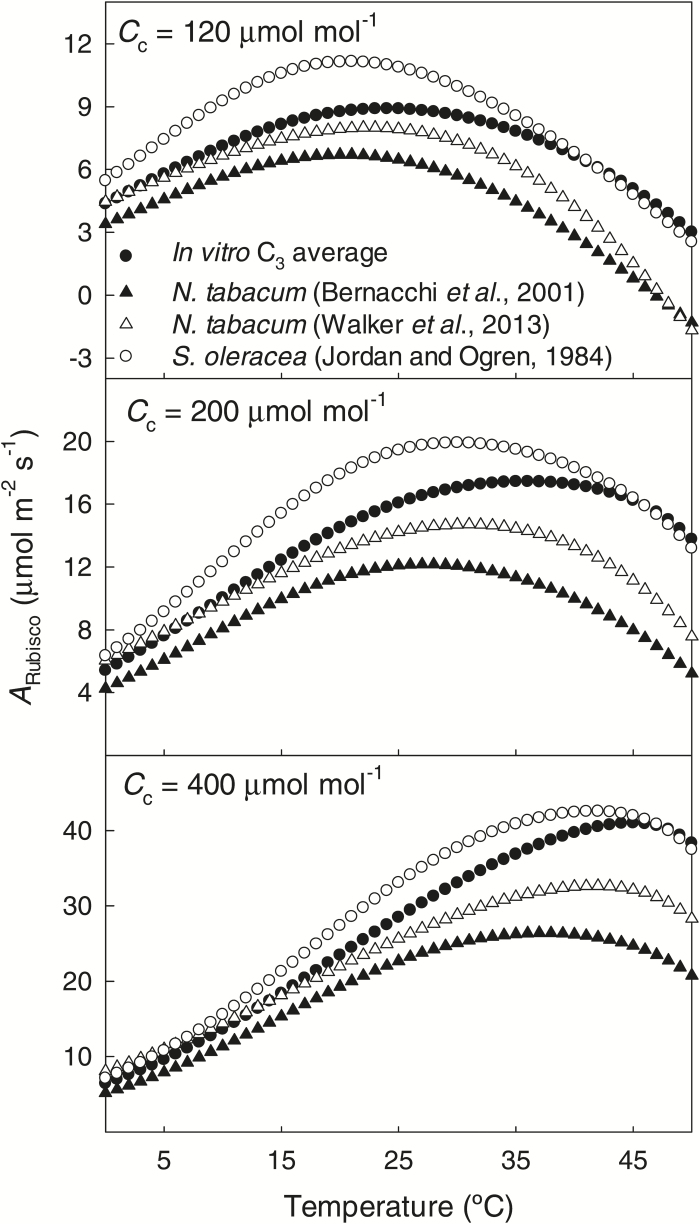
Fig. 8.
Comparison of the Rubisco-limited gross photosynthesis (ARubisco) among average of in vitro data reported for C3 plants and three widely cited datasets at chloroplastic CO2 concentrations (Cc) of 120, 200 and 400 μmol mol−1. The temperature dependence parameters of Sc/o, Kc, and Ko for in vitro average C3 plants (shown in Table 3) were the same as in Fig. 7, while those for in vivo Nicotiana tabacum (Bernacchi et al., 2001; Walker et al., 2013) and in vitro Spinacia oleracea (Jordan and Ogren, 1984) were obtained from the original papers (shown in Tables 2 and 4). Bernacchi et al. (2001), Walker et al. (2013) and Jordan and Ogren (1984) did not report values of the deactivation energy (∆Hd) and the entropy term (∆S) for , and the simulation assumed identical values to those used for the in vitro average C3 plants (indicated in the Methods). Note that Bernacchi et al. (2001) in vivo values have been derived without considering mesophyll conductance, while mesophyll conductance has been included in the in vivo estimates of Walker et al. (2013).

