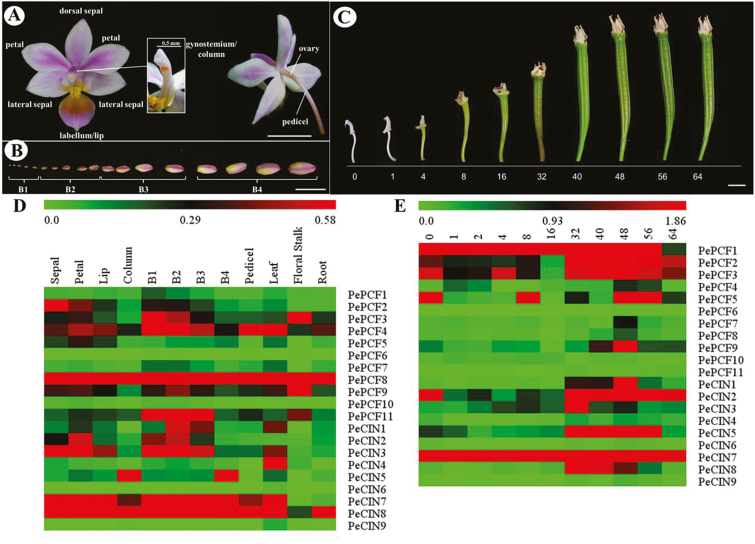
Fig. 3.
Heat map representation for the expression profiles of PeTCP genes. (A) Structure of a P. equestris flower. (B) Floral bud development stages from B1 to B4. (C) Morphological changes in the ovary at various days after pollination. Expression patterns of (D) 11 PePCF genes and nine PeCIN genes in various organs and developmental stages of floral bud; (E) 11 PePCF genes and nine PeCIN genes in various developmental stages of ovule. PeActin4 was used as an internal control. The expression levels are represented by the color bar. B1: stage 1 flower bud (0~1mm); B2: stage 2 flower bud (1~2mm); B3: stage 3 flower bud (2~5mm); B4: stage 4 flower bud (5~10mm); Co: column; DAP, days after pollination; F: floral stalk; L: leaf; Li: lip; P: pedicel; Pe: petals; R: root; Se: sepals. Scale bar: 1cm.

