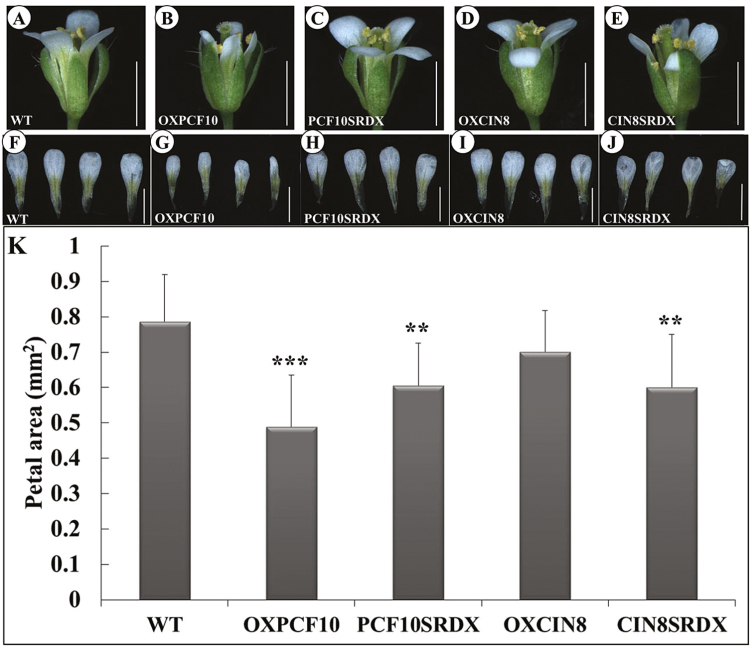
Fig. 9.
Flowers of WT and transgenic Arabidopsis plants. (A–E) Side views of WT (A), OXPCF10 (B), PCF10SRDX (C), OXCIN8 (D) and CIN8SRDX (E). (F–J) Petals of WT (F), OXPCF10 (G), PCF10SRDX (H), OXCIN8 (I) and CIN8SRDX (J). (K) Petal area of WT, OXPCF10, PCF10SRDX, OXCIN8 and CIN8SRDX. Asterisks indicate statistically significant differences (**P<0.01, ***P<0.001, compared with WT by Student’s t-test). Errors bar represent the SD of three biological repeats (n=10 each). Scale bars: 1mm.

