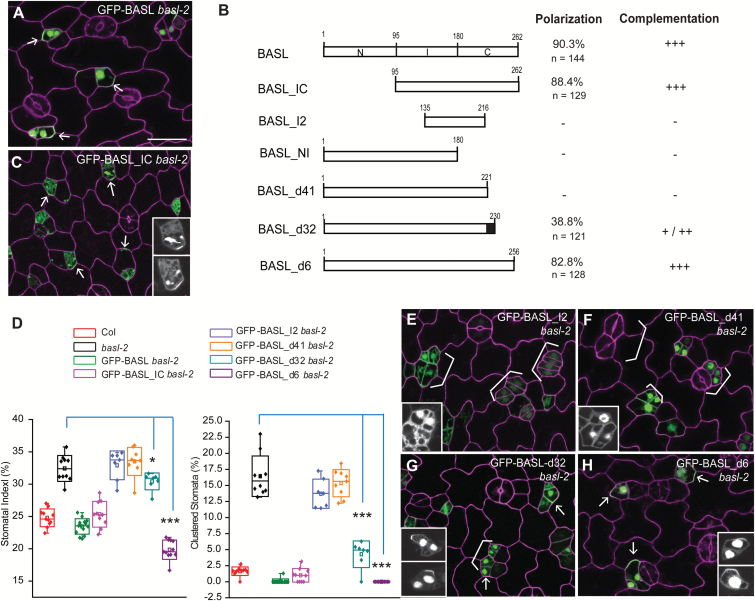
Fig. 2.
A small motif is required for BASL polarization.
(A) Confocal image to show GFP-BASL localization (green) in a 2-dpg adaxial basl-2 cotyledon counterstained with PI (magenta). White arrows mark evident protein polarization. Scale bars = 25 µm. The other panels are at the same scale. (B) Bar diagrams describe BASL truncations tested for subcellular localization and function in plants. The ‘polarization’ column displays the percentage of cells showing visible polarity in GFP-positive cells (n). Their effects in functional complementation are summarized as no effects (-), weak (+), medium (++), and strong (+++). The black box highlights the critical motif that recovered BASL polarity. (C) Confocal image of GFP-BASL_IC (green) in a 2-dpg basl-2 cotyledon counterstained with PI (magenta). Note the polar accumulation of BASL_IC (white arrows) in stomatal ACDs and its capability of complementation. The insets show the GFP channel only. (D) Box plots show quantification of stomatal phenotype in different genotypes. About 1500–2000 total cells were collected from 5-dpg cotyledons (n = 10–12 from two independent transgenic lines). BASL_I2 and BASL_d41 failed to rescue basl-2; BASL_d32 partially rescued basl-2 and BASL_d6 efficiently complemented basl-2. (Mann–Whitney test, *P < 0.05, ***P < 0.001). (E–H) Confocal images to show protein localization (green) of GFP-BASL_I2 (E), GFP-BASL_d41 (F), GFP-BASL_d32 (G), and GFP-BASL_d6 (H) in basl-2. The 2-dpg seedlings were stained with PI (magenta). White brackets indicate clustered stomata lineage cells, indicating failure to complement. Arrows show protein polarization in G and H. The small motif between BASL_41 and BASL_d31 (black box in B) contains information for BASL polarization and function. The insets show the GFP channel only for detailed protein localization.

