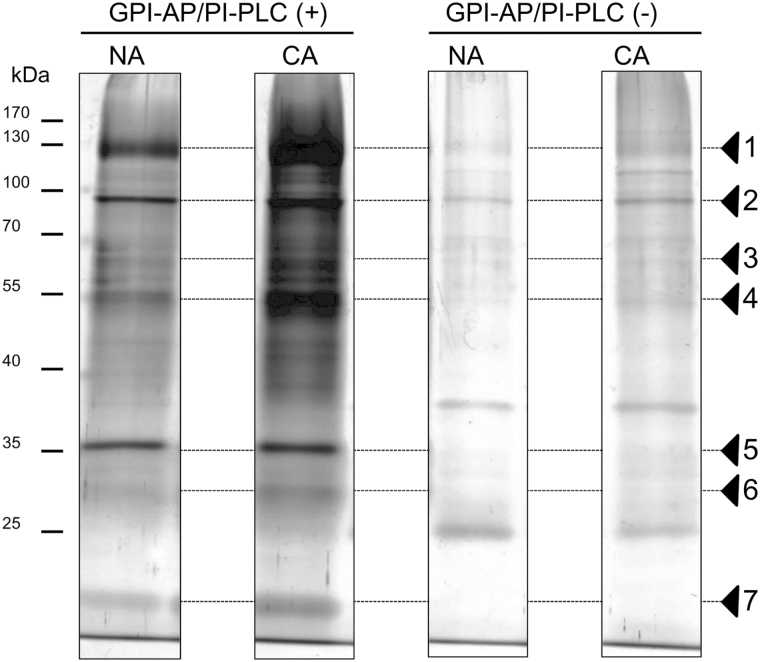
Fig. 1.
One-dimensional SDS–PAGE profiles of GPI-AP fractions with or without PI-PLC treatment. Each GPI-AP fraction (1 μg of protein equivalent) was loaded on a polyacrylamide gel, separated, and visualized by silver staining (Kawamura and Uemura, 2003). Arrowheads indicate major protein bands visualized in the presence or absence of exogenous PI-PLC during the preparation process. Non-acclimated (NA) and cold-acclimated (CA) samples were used.

