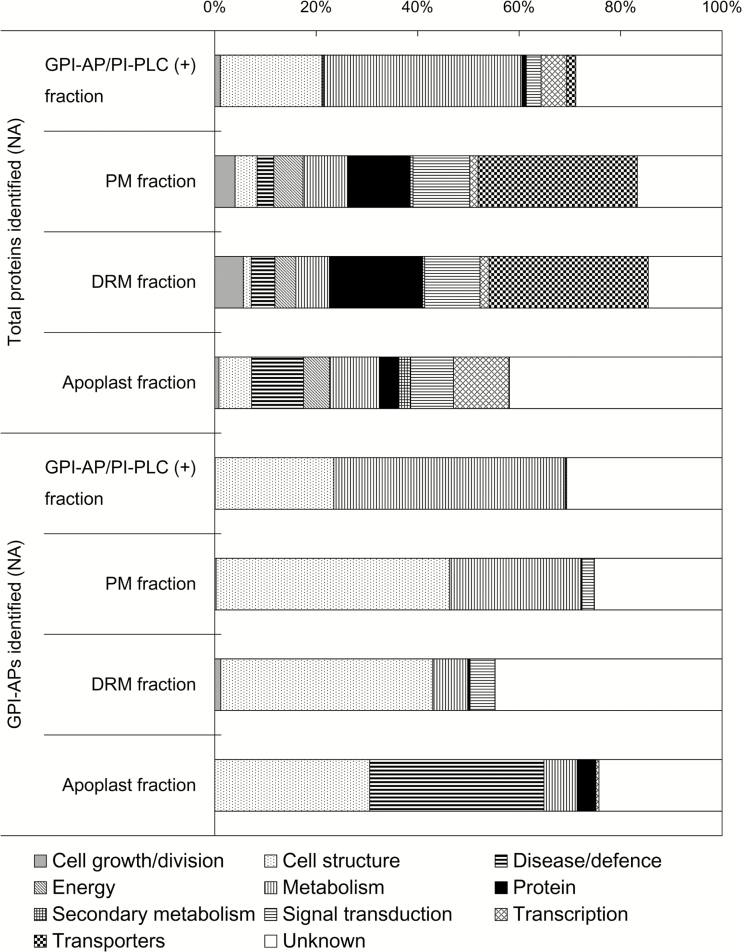
Fig. 3.
Functional categorization of total proteins and GPI-APs identified in non-acclimated samples. All GPI-APs identified were classified into 11 functional categories based on the definition proposed by Bevan et al. (1998). Proportions of each functional category in bar charts were calculated by the proportions of each functional category based on the normalized abundance of each GPI-AP identified. The upper and lower part of the graph indicate the functional distribution of total proteins and only GPI-APs identified in non-acclimated samples.

