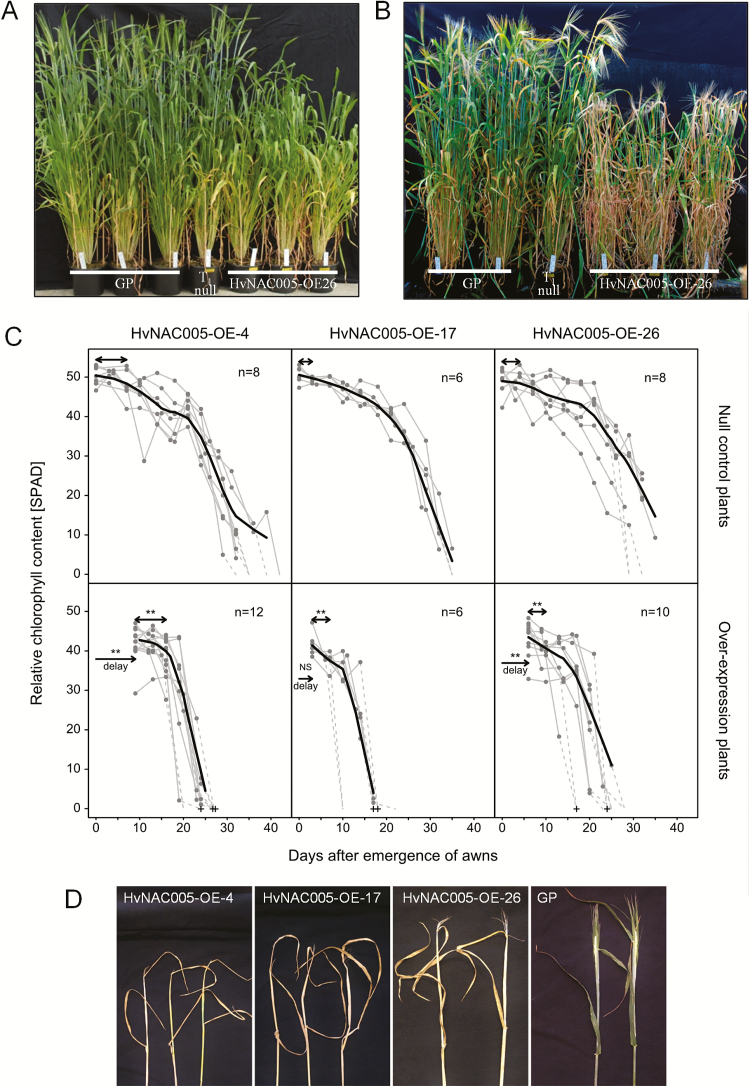
Fig. 4.
Characterization of T1 HvNAC005 over-expression plants. (A) Phenotype of plants at the heading stage, 3 months after sowing, line HvNAC005-OE-26. (B) Senescence phenotype of plants 4 months after sowing, line HvNAC005-OE-26 compared with control plants. (C) Relative chlorophyll content (SPAD values=mean of three measurements per leaf) in flag leaves of three independent transgenic lines HvNAC005-OE-4, -17, and -26, from greenhouse grown plants. Measurements were made twice a week on the two earliest developed tillers of each plant and started when awns were visible at the top of the leaf sheaths. The upper panels show results for null-transgenic control plants and the lower panels for the HvNAC005 over-expression plants. Values for individual leaves are shown in grey. The bold line is a lowess smooth regression line through the data points (R software version 3.0.1, R Core Team 2015), excluding the data points from dead, shrivelled leaves. SPAD values from these leaves could not be obtained, and they were set to SPAD=0. These zero data points for dead leaves are connected to the last data point from the living leaf by a dashed line. The starting time was scaled to start at time=0 for all of the control plants, causing the data points for different leaves not to be completely equidistant. For the over-expression plants, the starting time was shifted by the average delay in awn emergence compared with the respective control plants, indicated by a uni-directional arrow. Asterisks indicate whether this delay was statistical significant, P ≤0.05 (t test, R software version 3.0.1). Bi-directional arrows indicate the first two sampling time points used to compare the initial chlorophyll content between control and over-expression plants. Asterisks indicate a statistical significant difference in this comparison, P ≤0.05 (t test, R software version 3.0.1, R Core Team, 2015). (D) Senesced/dead tillers of the three lines HvNAC005-OE-4, -17, and -26 sampled 94 d after sowing, compared with tillers of ‘Golden Promise’ of a similar age. n, Number of flag leaves (number of plants is n/2). +, Indicates tillers shown in Fig. 4D; NS, not statistical significant. GP, ‘Golden Promise’ control plants; T1 null, null-transgenic T1 plants. (This figure is available in colour at JXB online).

