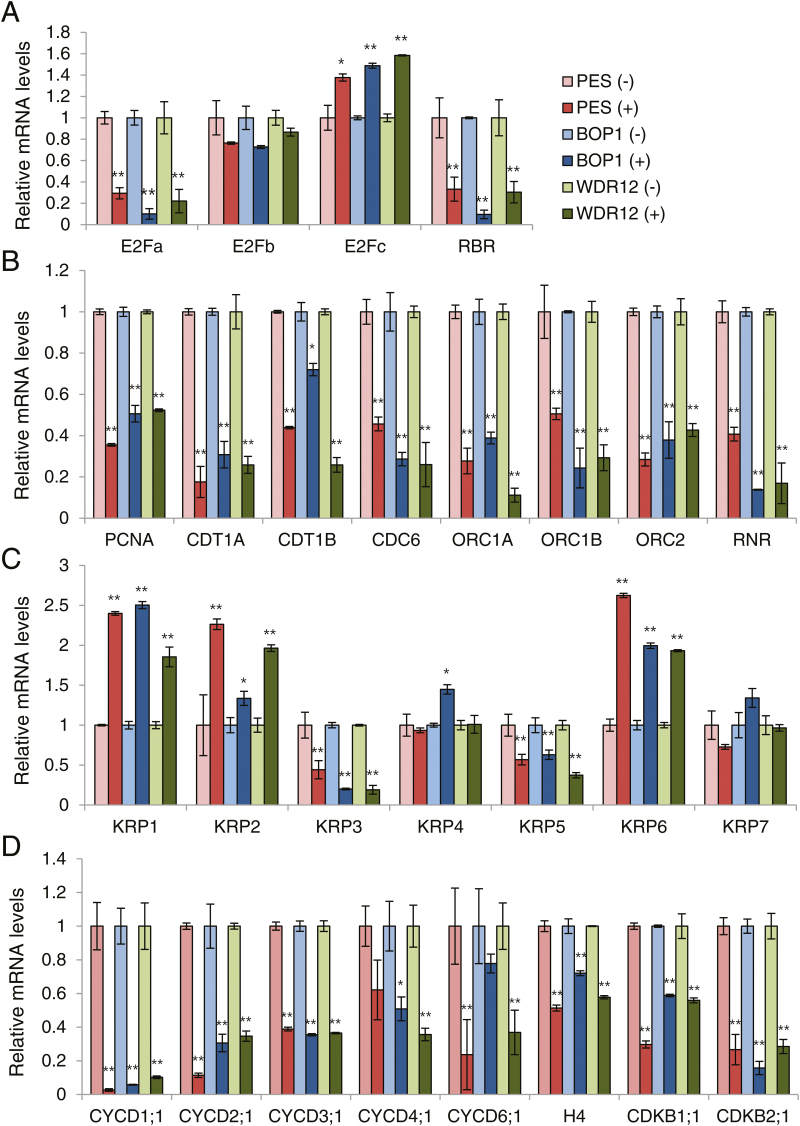
Fig. 7.
Expression of cell cycle-related genes. Real-time quantitative RT-PCR analyses were performed using the first leaves of the PES (#28), BOP1 (#7), and WDR12 (#8) RNAi seedlings sprayed with ethanol (–) or 20 µM DEX (+). Transcript levels are quantified relative to (–)DEX samples using UBC10 mRNA levels as a control. Data points represent means ±SD of three experiments. Asterisks denote statistical significance of the differences between the (–)DEX and (+)DEX samples: *, P≤0.05; **, P≤0.01. (A) E2F/RBR pathway genes. (B) S-phase genes. (C) KRP family genes. (D) CycD family, histone H4, and CDKB genes. (This figure is available in colour at JXB online.)

