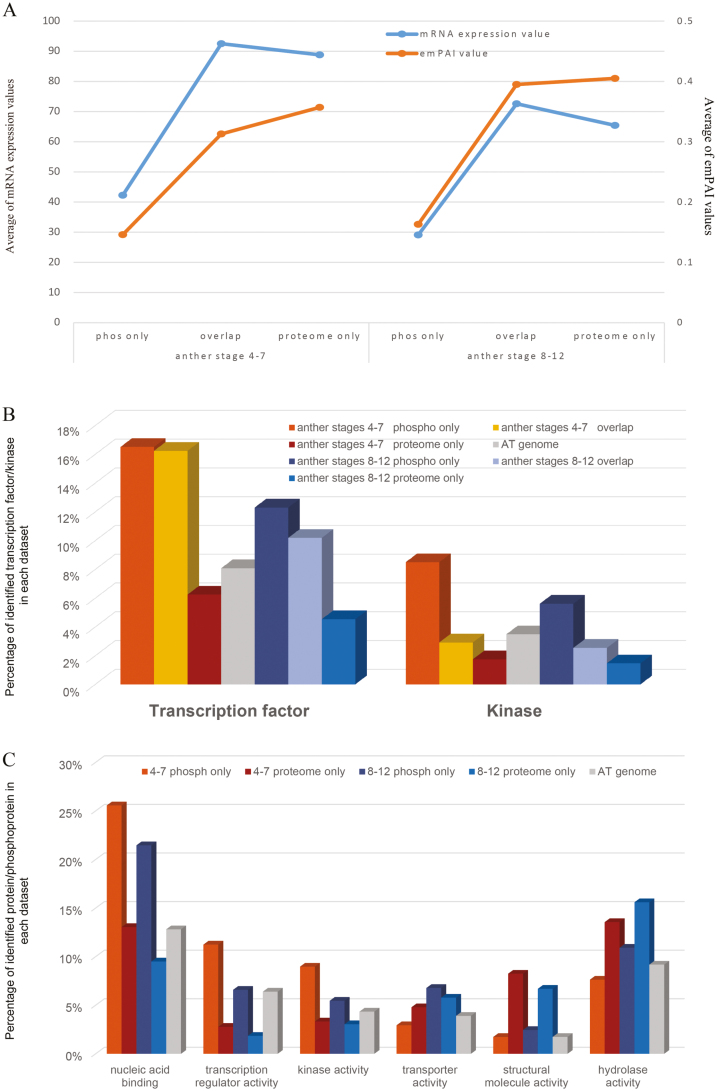
Fig. 2.
Enrichment analysis of low-abundance and regulatory proteins in the proteome and phosphoproteome of anthers in phases I and II. (A) Average abundance of proteins identified in three datasets (proteins identified only in the phosphoproteomic analysis, proteins identified in both analyses and proteins identified only in the proteomic analysis) in phases I and II. (B) Distribution of TFs and kinases/phosphatases in three datasets, the phosphoproteome only, both the proteome and phosphoproteome and the proteome only. (C) Over/under-represented gene ontology (GO) molecular function categories in the proteome and phosphoproteome of two phases. Regulatory proteins are dominantly phosphorylated, especially in anther phase I.

