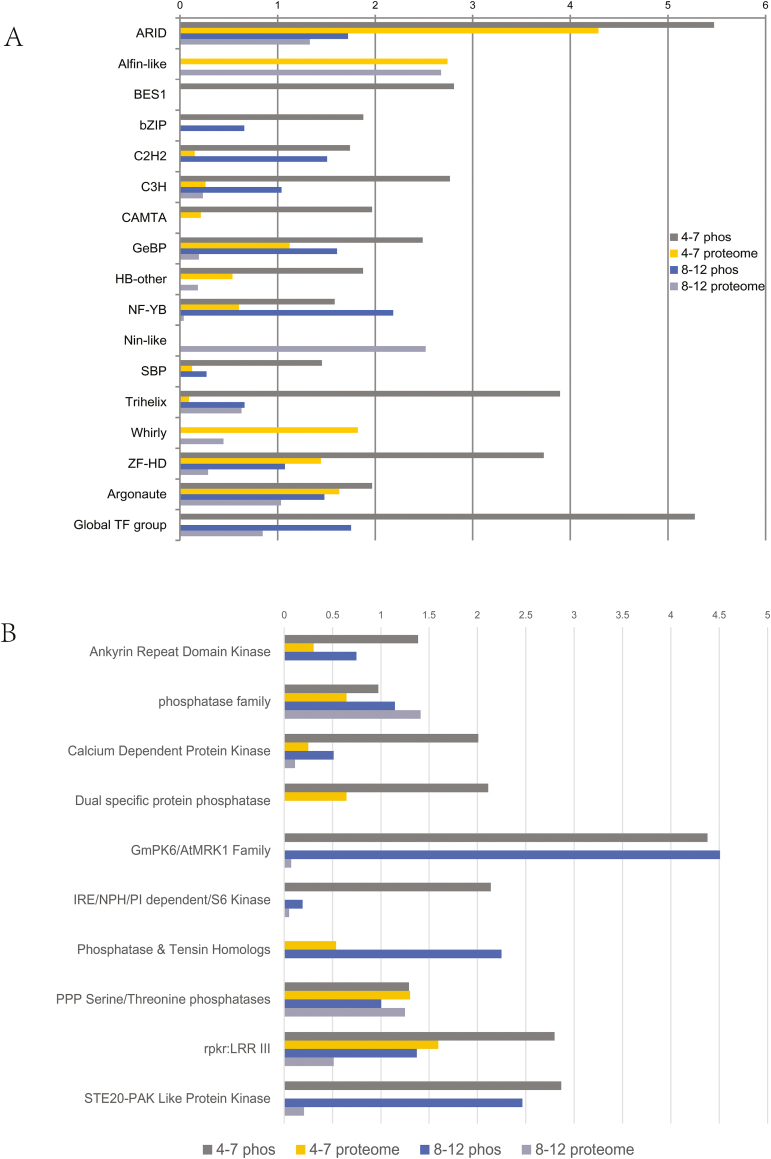
Fig. 5.
An overview of the TFs and kinases/phosphatases identified in proteome and phosphoproteome of developing anthers at phase I and II. (A) The over-represented TF families in the proteome and phosphoproteome of anther phases I and II, compared with the whole Arabidopsis genome (value >1.33 indicates P<0.05). The results showed that the phosphorylation patterns differ for TF families in different phases. (B) The enriched kinase or phosphatase families in proteome and phosphoproteome of anther phase I and II, compared with the whole Arabidopsis genome (value >1.33 indicates P<0.05).

