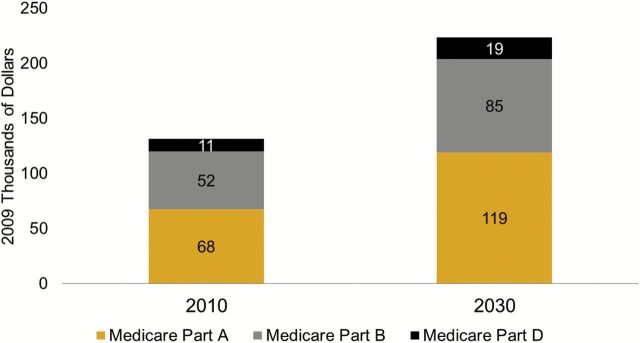
Figure 2.
Net present value of lifetime Medicare spending per person aged 65 in 2010 and 2030. Figure is based on projections from the Future Elderly Model using data from the Health and Retirement Study, the National Health Interview Study, and the Medicare Current Beneficiary Survey. Spending projections assume cost growth consistent with the targets set in the Affordable Care Act, that is, below Gross Domestic Product growth until 2019 and 1% above GDP growth from 2019 to 2030. Spending is discounted with a 3% rate from age 65 onward.

