Figure 2.

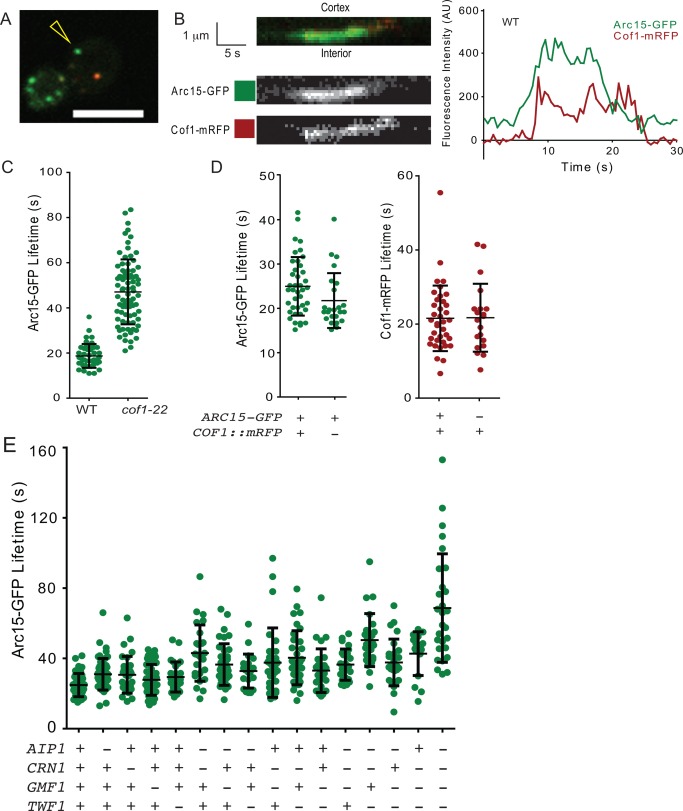
Actin patch maturation is delayed in disassembly mutants. (A) Still image from Supporting Information, Movie S1. Arc15‐GFP and Cof1‐mRFP were imaged at 0.5 s intervals. Scale bar = 5 μm. (B) Example kymograph and intensity profile of the wild type actin patch, designated in (A) by yellow arrowhead. Left, top row: merged channels. Scale bar = 1 μm (y‐axis), 5 s (x‐axis). Left, middle row: Green (Arc15‐GFP) channel. Left, bottom row: Red (Cof1‐mRFP) channel. Right: Intensity profile of the kymograph. Background was subtracted as described in the section titled Materials and Methods. (C) Effect of cof1‐22 mutation on Arc15‐GFP lifetime. Strains: left, DDY2752 (wild type); right, CY384 (cof1‐22). Unlike the other experiments in this figure, these strains do not express COF1::mRFP. (D) Comparison of average Arc15‐GFP lifetime in strains with and without the COF1::mRFP plasmid. Strains: left, CY259 (data is the same as in Fig. 2E); right, same mother strain (DDY2752) transformed with empty vector, pRS415 [Sikorski and Hieter, 1989]. The difference in average Arc15‐GFP lifetime between the two strains was not significant (p = 0.06, Student's t‐test). Comparison of average Cof1‐mRFP lifetime in strains with and without the Arc15‐GFP marker. Strains: left, CY259; right, equivalent strain without Arc15‐GFP (DDY904 transformed with pBJ1807 COF1::mRFP). The difference between the two strains is not significant (p = 0.95, Student's t‐test). (E) Arc15‐GFP lifetime in the indicated mutants (from left to right: yeast strains CY259, CY262, CY303, CY260, CY282, CY307, CY261, CY280, CY304, CY305, CY279, CY306, CY310, CY281, CY309, CY308; n ≥ 21). Points in the graph represent lifetimes of individual patches, and black brackets represent the population mean and standard deviation. Results are also listed in Supporting Information, Table S3.
