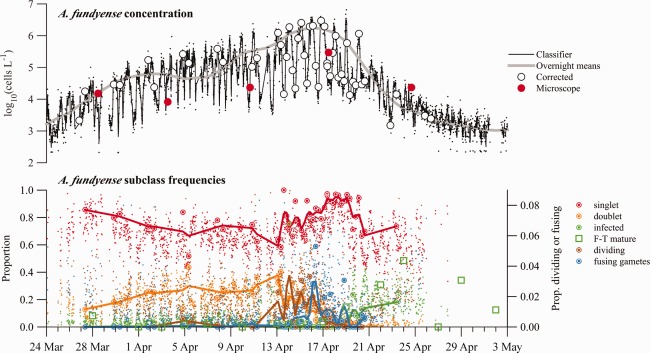
Figure 3.

(Top axes) Abundance estimates derived from the two A. fundyense subclass machine classifier. Lines are loess smoothing results from sample estimates. Classifier data (fine black points) are estimates taken directly from the 2‐subclass classifier output. Overnight means are derived from observations collected between 21:00 and 03:00 h EDT when A. fundyense were concentrated near the IFCB intake. Corrected data are abundance estimates from manually corrected IFCB samples. Microscope data are abundance estimates from weekly surveys (Bottom axes) Select A. fundyense subclass frequencies. Large ringed circles are manually corrected estimates from IFCB images and fine points are results from the 11‐subclass machine classifier. Lines are loess smoothing results from manually corrected data. Fusing gametes and dividing vegetative cells were never greater than 5% of A. fundyense images within a single sample and are plotted against the right y‐axis. Open square symbols are FISH‐TSA‐based estimates of mature Amoebophrya infection prevalence.
