
Figure 3.
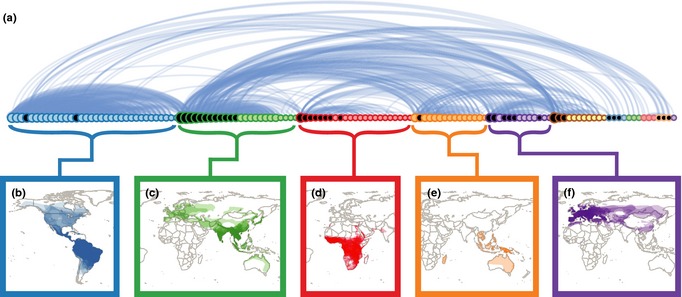
(a) The viral sharing network in bats, organised by communities. Each circle represents a bat species. Lines and their thickness represent number of viruses shared between species. Circle size represents the host's degree and is coloured by community. Species with a black centre were classified as part of multiple communities in an alternative method for community identification. (See Fig. S1 for diagram with species names) Panels (b) through (f) show the distributions of the species (with darker areas representing more host species) that make up the five largest communities. Important viruses include (b) Dengue, Eastern equine encephalitis and Yellow fever viruses in the blue community, (c) Japanese encephalitis virus and SARS coronavirus in the green community, (d) Ebola‐Zaire and Lake Victoria Marburg viruses in the red community, (e) Hendra and Nipah viruses in the orange community, (f) European bat lyssavirus‐1 and ‐2, and Issyk‐kul virus in the purple community.