
Figure 1. NPC neuronal models show increased HDAC2 protein levels and activity, effect that is prevented with Imatinib.
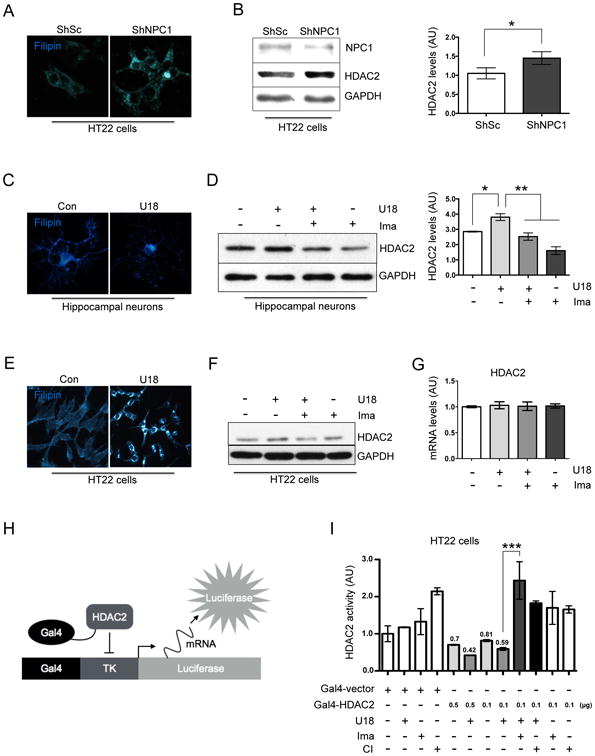
(A) Representative images showing filipin staining of HT22 cells transfected for 48 h with a plasmid expressing ShRNA against NPC1 (ShNPC1) or ShRNA scramble (ShSc) as a control. (B) Western blot analysis and quantification of HDAC2 expression normalized against GAPDH levels, of HT22 cells transfected for 48 h with a plasmid expressing a ShRNA against NPC1 (ShNPC1) or ShRNA scramble (ShSc) as a control (n=3). (C) Representative filipin staining images of hippocampal neurons (7DIV) treated either with vehicle (Ct) or U18 0.5 μg/mL for 24 h. (D) Western blot analysis and quantification of HDAC2 expression normalized against GAPDH levels of hippocampal neurons (7DIV) treated either with vehicle (control), U18 0.5 μg/mL, U18 0.5 μg/mL plus Imatinib (Ima) 5 μM or Ima 5 μM for 24 h (n=3). (E) Representative filipin images of HT22 cells treated with vehicle (Ct) or U18 0.5 μg/mL for 24h. (F) Western blot analysis of HDAC2 and (G) quantitative PCR results of Hdac2 mRNA levels in HT22 cells treated with vehicle (control), U18 0.5 μg/mL, U18 0.5 μg/mL plus Imatinib (Ima) 5 μM or Imatinib 5 μM for 24h (n=3). (H) Diagram of the HDAC2 repression activity assay. (I) HDAC2 repression activity assay were as follows: HT22 cells were co-transfected with the Gal4-TK-Luciferase, Gal4-Vector or decreasing quantities of Gal4-HDAC2. 24h after transfection, the cells were pre-treated with Imatinib 5 μM or CI994 (CI) 1 μM and 1 hour later the cells were treated with U18 0.5 μg/mL for 24 h. Results are from three independent experiments. *p < 0.05; **p < 0.01; ***p < 0.001; values are mean ± SEM.