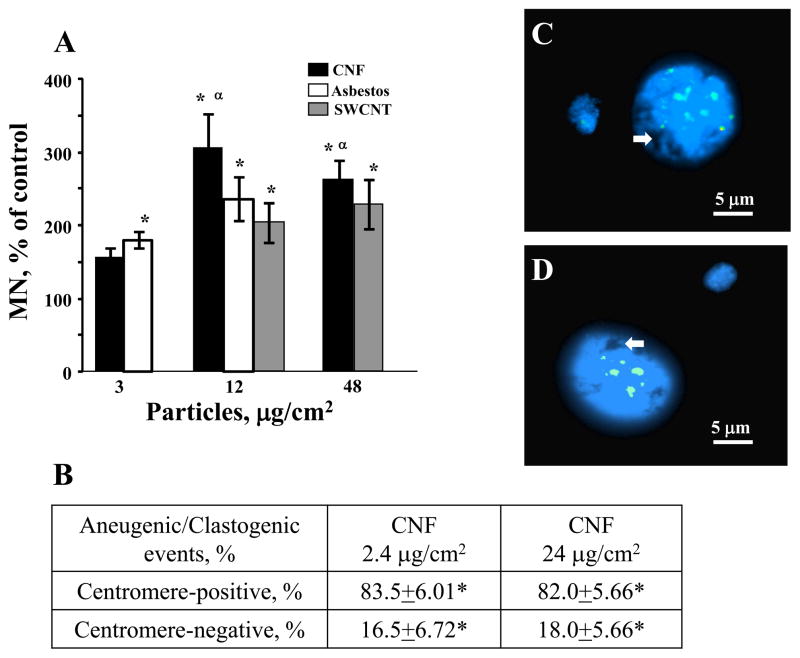
Figure 7.
Chromosomal changes induced by fibrous nanomaterials: (A) Micronucleated cell induction in 1000 scored cells after challenge with CNF, SWCNT or asbestos in V79 cells. ■ – exposure with CNF; ↑ – exposure with asbestos,  – exposure with SWCNT. Data are shown as mean values ± SEM (n=3 experiments); *p<0.05, vs control; αp<0.05, vs 3 μg/cm2 of the same treatment. (B) Number of centromere-positive and centromere-negative MN in SEAC incubated with CNF (2.4 and 24 μg/cm2). Data are shown as mean values ± SEM; *p<0.05, vs control. (C) Centromere-positive (aneugenic) and (D) centromere-negative (clastogenic) MN after exposure to 2.4 mg/cm2 CNF. Arrows indicate CNF within a nucleus.

