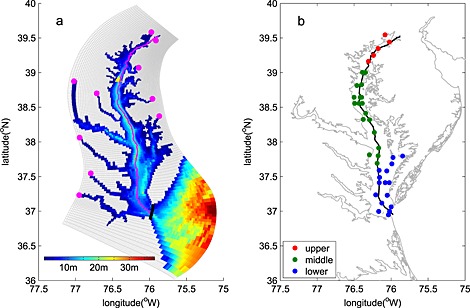
Figure 1.

Chesapeake Bay (a) model grid, bathymetry, location of riverine inputs (magenta dots), and Thomas Point Light Buoy used for wind forcing (yellow triangle); (b) map illustrating location of EPA Chesapeake Bay Program Water Quality Monitoring Stations in the upper (red circles), middle (green circles), and lower (blue circles) bay. The black line in Figure 1a denotes the edge of the bay interior, over which the bay‐wide budget numbers are computed. The magenta line in Figure 1a and black line in Figure 1b show the stations along the trench of the bay used in Figures 3, 6, and 8.
