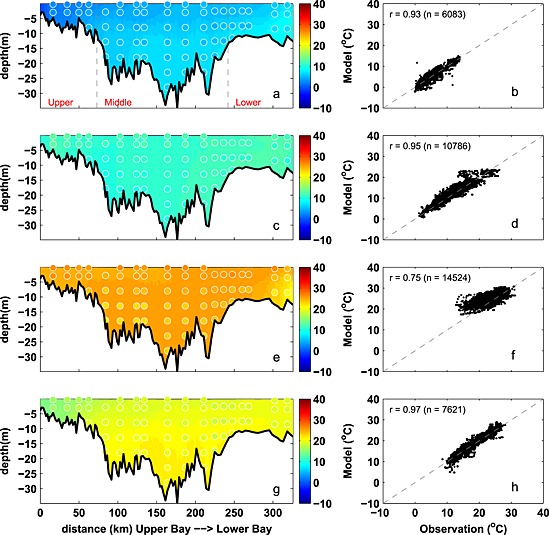
Figure 3.

Observed and simulated seasonal temperature from 2001 to 2005. (a, c, e, and g) Temperature along the trench with background color representing the simulation and circles showing the observations. (b, d, f, and h) Modeled versus observed temperature at coincident times and locations, including correlation coefficient (r) and number of available data (n). Panels from top to bottom, winter (December–February), spring (March–May), summer (June–August), and fall (Septemebr–November). Gray dashed lines in Figure 3a denote the boundaries of the upper, middle, and lower bay. Stations from upper bay to lower bay are as follows: CB2.1, CB2.2, CB3.1, CB3.2, CB3.3C, CB4.1C, CB4.2C, CB4.3C, CB5.1, CB5.2, CB5.3, CB5.4, CB5.5, CB6.1, CB6.2, CB6.3, CB7.3, and CB7.4.
