Figure 4.

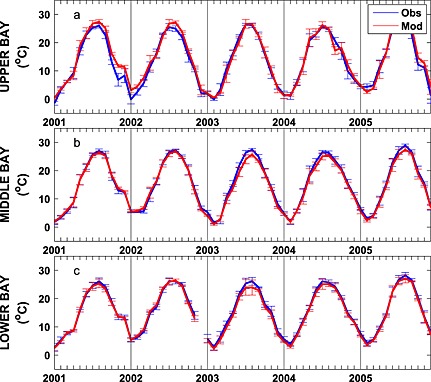
Observed and simulated mean monthly depth‐averaged temperature from 2001 to 2005 averaged over the (a) upper, (b) middle, and (c) lower bay stations illustrated in Figure 1. Vertical bars represent ±1 standard deviation.

Observed and simulated mean monthly depth‐averaged temperature from 2001 to 2005 averaged over the (a) upper, (b) middle, and (c) lower bay stations illustrated in Figure 1. Vertical bars represent ±1 standard deviation.