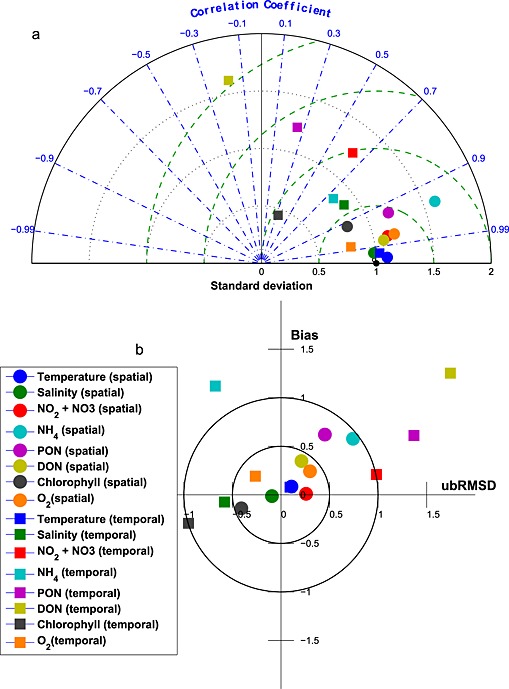
Figure 5.

(a) Taylor and (b) Target diagrams illustrating model skill for hydrodynamic and biogeochemical fields [Taylor, 2001; Hofmann et al., 2008; Jolliff et al., 2009]. Squares represent temporal model skill, which was calculated by comparing time series of observational and model data. Circles represent spatial model skill, which was calculated by comparing the vertically integrated spatial series of observational and model data along the trench. Different colors represent different variables. In Figure 5a the solid lines represent lines of constant RMSD. In Figure 5b, the green dashed lines represent lines of constant unbiased RMSD, the blue dash‐dotted lines represent lines of constant correlation coefficient, and the black dotted lines represent lines of constant standard deviation. For a more detailed description of these diagrams and skill metrics, see section 3.1.
