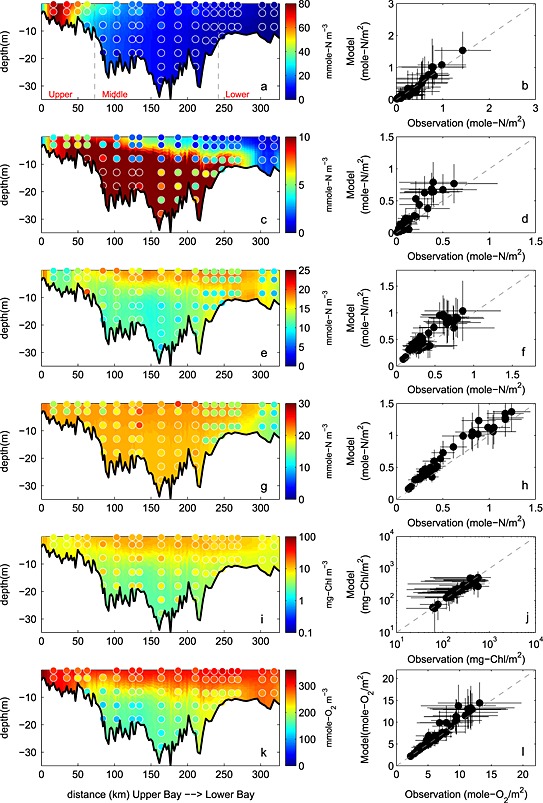
Figure 8.

Observed and simulated climatological (average over 5 years) biogeochemical fields from 2001 to 2005. (a and b) NO2 + NO3, (c and d) NH4, (e and f) PON, (g and h) DON, (i and j) chlorophyll, and (k and l) oxygen. (Figures 8a, 8c, 8e, 8g, 8i, and 8k) concentrations along the trench with background color representing the simulation and circles showing the observations. (Figures 8b, 8d, 8f, 8h, 8j, and 8l) vertically integrated observed and simulated concentrations at stations shown in Figure 1b with error bars showing ±1 standard deviation relative to the 5 year mean. Gray dashed lines in Figure 8a denote the boundaries of the upper, middle, and lower bay.
