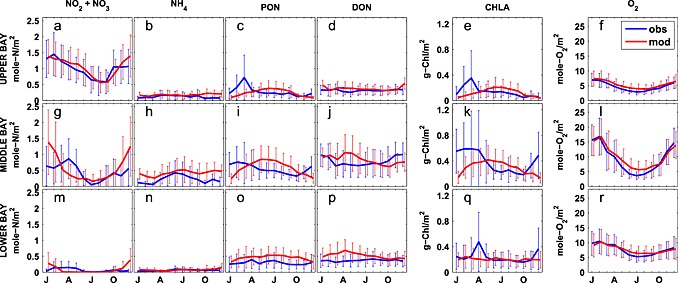
Figure 9.

Observed and simulated vertically integrated monthly biogeochemical fields averaged over 2001–2005. Error bars are ±1 standard deviations. (a, g, and m) NO2 + NO3, (b, h, and n) NH4, (c, i, and o) PON, (d, j, and p) DON, (e, k, and q) chlorophyll, and (f, l, and r) oxygen. Panels from top to bottom, upper, middle, and lower bay.
