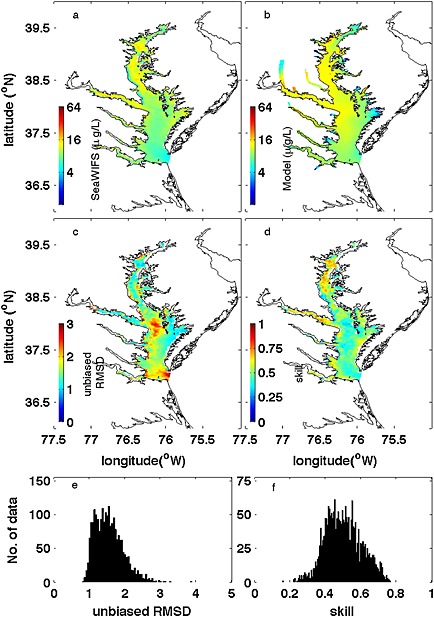
Figure 10.

Comparison between 5 year (2001–2005) averaged sea surface chlorophyll from (a) SeaWiFS and (b) model simulation. Skill assessment is illustrated by (c) unbiased RMSD, and (d) Willmott skill together with histograms of (e) unbiased RMSD and (f) Willmott skill.
