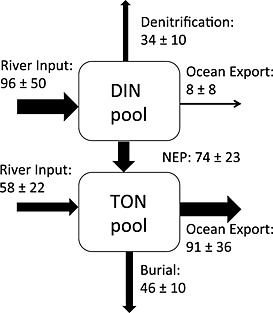
Figure 11.

The nitrogen budget for 2001–2005 in the Chesapeake Bay from our modeling system (unit: 1 × 10⁹ g N yr−1). The exchange of DIN/PON between the internal bay and exterior ocean was estimated using velocity and DIN/PON concentration at each time step at a cross section of the bay mouth (red line in Figure 1a). Net ecosystem production (NEP) was estimated as primary production minus phytoplankton and zooplankton respiration and TON remineralization. Error bars represent the standard deviations computed for the mean of the five annual values.
