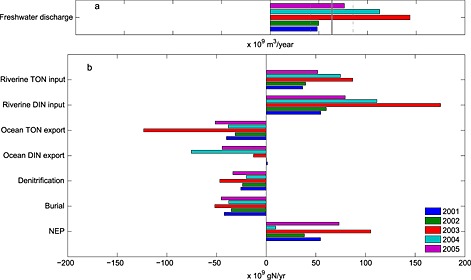
Figure 12.

(a) Freshwater discharge for the 2001–2005 period. The long‐term (1980–2008) mean ± standard deviation of discharge computed from DLEM are included as the gray solid and dashed lines. (b) Interannual variability of nitrogen fluxes computed for the 2001–2005 analysis period.
